Article
Sep 17, 2026
The Recruitment Agency KPIs That Actually Matter in 2026
The recruitment agency KPIs that actually matter in 2026, with benchmarks: the money, pipeline, quality, and BD metrics that predict revenue.

Recruiters are busier than they have ever been, and busyness is not translating into results. The average recruiter now handles 93% more applications than in 2021 with 14% fewer colleagues, while only a small fraction of applicants ever get hired. That widening gap between effort and outcome is a visibility problem rather than a motivation one, and most agencies make it worse by measuring the wrong things.
The dashboards on most desks are full of activity: calls made, CVs sent, roles open. Those numbers show effort, and they say almost nothing about whether the desk is profitable, scalable, or about to lose a client. This guide covers the recruitment agency KPIs that actually matter in 2026, the benchmarks to judge them against, and how to use a small set of them to run the business rather than just report on it.
Why most agency metrics mislead
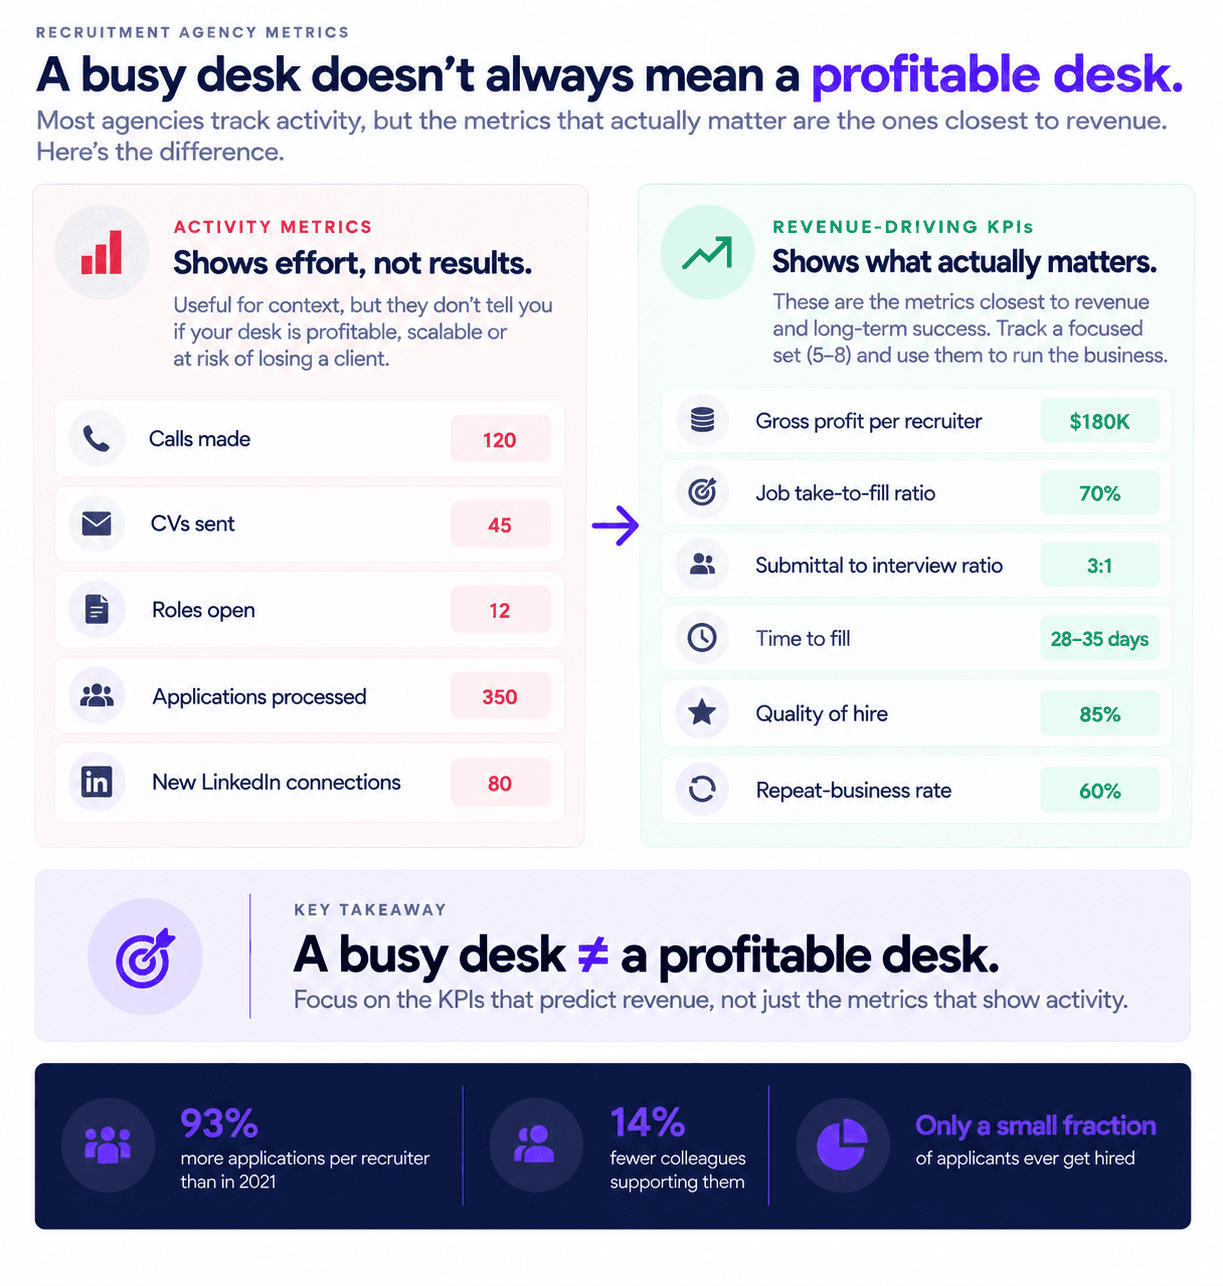
The starting problem is a confusion between a metric and a KPI. A metric is any measurement of the recruiting process, while a KPI is the handful you have chosen to steer the business by, and most metrics should stay as context rather than becoming KPIs. Tracking 25 numbers produces reports nobody acts on, and five to eight genuine KPIs is plenty for most firms, made up of the few that predict revenue plus two or three you are actively working to improve.
The principle for choosing them is simple: the closer a metric sits to revenue, the more weight it deserves. Activity metrics sit far from revenue, which is why a desk can look busy on paper and still be unprofitable. One more rule matters as much as the choice of metrics, which is to benchmark against your own past performance first, since your trend line tells you more about whether you are improving than any single industry average that was measured on a different niche.
The money metrics that sit closest to revenue
For an agency, the metrics nearest the money deserve to be permanent KPIs. Gross profit per recruiter is the clearest single measure of a productive desk, because it tells you whether each biller is generating enough margin to justify their fully loaded cost, which ties directly to the economics of running the agency. It is the number that separates a team that is merely busy from one that is genuinely productive.
Alongside it, the job take-to-fill ratio tells you whether the work you accept actually converts, since gross profit per recruiter and this ratio usually sit closest to revenue of any metrics on a desk. A low fill ratio is a sign you are taking on roles you cannot place, which burns recruiter time without producing fees. For agencies doing retained or executive work, repeat-business rate belongs here too, because a client who returns is worth far more than one you win once, and repeat work is a leading indicator of delivery quality that raw placement counts hide.

The pipeline metrics that predict those outcomes
The money metrics tell you where you ended up, and the pipeline metrics tell you where the desk is leaking before the numbers show it. The submittal-to-interview ratio is the most revealing of these, because it is where most desks quietly lose value and it runs around 3 to 1 across staffing agencies. When that ratio slips, it usually points to a sourcing quality problem or a recruiter who has not fully understood the brief, and catching it early lets you fix the issue before it shows up as missed placements. Improving it is largely a matter of better shortlists, which is exactly what strong candidate matching and better sourcing produce.
Speed metrics matter because clients feel them directly. Time to fill measures the full span from a role opening to an offer being accepted, and strong perm desks fill mid-level roles in roughly 28 to 35 days while executive searches run 60 to 90, against a broader industry average near 36 to 42 days. Time to first submittal is the earlier signal within that, measuring the days from taking a role to putting the first credible candidate in front of the client, and it is often the first thing a client uses to judge you. Time to hire, measured from a candidate entering your pipeline to acceptance, is cleaner for judging recruiter execution because it strips out the delay in finding the right person. At the end of the funnel, the interview-to-offer ratio sits near 3 to 1, and offer acceptance rate is a health check worth watching closely, since a healthy benchmark is 80% or above and anything below 75% means one in four offers is being declined, usually a sign of a mismatch on salary or expectations set earlier in the process.
The quality metric that protects your fee
Filling roles quickly means little if the hires do not stick, and for an agency a fall-off inside the guarantee period erases the fee entirely. Quality of hire is therefore a KPI worth the effort to measure, even though only about a quarter of organizations feel confident measuring it. No single number captures it, so the practical approach is a composite of 90-day retention, hiring manager satisfaction, and first-year retention, which together give a defensible read you can track over time.
For agencies specifically, the fall-off rate against your guarantee period is the sharpest version of this metric, because it maps directly to revenue you keep versus revenue you refund. Cost per hire is useful context rather than a headline KPI for most desks, and it is worth knowing the benchmarks vary enormously by level, with a median around $1,340 that rises to roughly $10,625 for executive roles. Tracking quality of hire is also what lets you prove your value to clients weighing whether to bring hiring in-house, since a strong retention record is the clearest evidence that your placements outperform what they would find alone.
The business development metrics agencies forget
Most agencies measure delivery in detail and leave the front of the funnel unmeasured, which is why pipelines run dry without warning. The business development side deserves its own KPIs. Positive reply rate to your outreach is the key one, and it is a direct read on whether your targeting and messaging are working, since a rate under 20% signals over-reliance on saturated channels while well-targeted, personalized outreach across channels can sustain 40% or more. That difference is not cosmetic, because it is the gap between contacting 250 companies and 667 to land the same result, which is a large amount of wasted recruiter time.
Beyond reply rate, track the number of qualified client conversations you generate and your win rate on new business, so you can see whether the top of the funnel is healthy long before it affects placements. Improving these numbers is a matter of reaching the right prospects about the roles where an agency wins with a message that leads with value rather than a generic pitch, tracked through your cold email performance. Reaching a client quickly once they show interest matters too, which is why speed to lead belongs on the BD dashboard, and running the whole motion as a system is part of generating leads with AI.
How to actually use them
A dashboard only creates value when someone acts on it, so the cadence matters as much as the choice of metrics. Review the fast-moving operational numbers such as pipeline velocity and submission ratios weekly, review the strategic metrics such as cost per hire, quality of hire, and retention monthly, and run a full KPI audit each quarter to adjust targets against market conditions and client feedback. Most teams do best to start with just three, such as time to fill, positive reply rate, and quality of hire, get those reliable, and expand from there rather than building a sprawling dashboard on day one.
The practical barrier is data capture, because manually updating a dashboard is the first thing that gets abandoned when the desk is busy. Automating the capture and reporting is what makes a KPI practice stick, and it is another place where giving recruiters their time back with automation pays off, since the data then updates itself rather than depending on someone remembering to log it. Reliable numbers are also what let you win more clients by proving your performance rather than asserting it.
What are the most important KPIs for a recruitment agency?
Start with the ones closest to revenue: gross profit per recruiter, which shows whether each biller is productive, and the job take-to-fill ratio, which shows whether the work you accept converts. Add the pipeline metrics that predict those outcomes, particularly submittal-to-interview ratio, time to fill, and offer acceptance rate, plus quality of hire measured through retention and hiring manager satisfaction. Finally, track positive reply rate on your business development so the pipeline stays full. That is five to eight KPIs, which is enough to run the business without drowning in reports.
What is a good time to fill for a recruitment agency?
It depends on the role, but strong perm desks fill mid-level positions in about 28 to 35 days, while executive searches typically run 60 to 90 days, against a broader industry average near 36 to 42 days. Time to first submittal is worth watching alongside it, since getting a credible candidate in front of the client quickly is often what wins the relationship. The most useful comparison is against your own past performance on similar roles, because averages measured across different niches can be misleading.
How many KPIs should a recruitment agency track?
Five to eight is plenty for most agencies. The aim is a small set of KPIs that predict revenue, held as permanent measures, plus two or three you are actively trying to improve at any given time. Tracking everything produces reports nobody acts on, so the skill is deciding which few metrics genuinely steer the business and treating the rest as context you can look at when a KPI moves.
Bringing it together

The recruitment agency KPIs that matter in 2026 are the ones that sit close to revenue and predict it: gross profit per recruiter and job fill ratio for the money, submittal-to-interview and time to fill for the pipeline, quality of hire and fall-off rate for the value you deliver, and positive reply rate for the business development that keeps it all fed. Keep the set small, benchmark against your own trend line first, automate the data capture so the dashboard stays current, and act on the widest gap each quarter. Measured this way, KPIs stop being a reporting chore and become how you run a profitable, scalable desk.
If you want help building the sourcing and outreach systems that move these numbers, and the automation that captures them without extra work, book a call with the Novoslo team and we will show you exactly how it works.