Article
Jan 30, 2026
Best Ways to Measure Success of AI Transformation
Discover a simple 3-3-3 framework to measure AI transformation success which shows you what to track, when to measure, and how to prove real ROI.

There was a study done by MIT in 2025 that claimed 95% of AI projects showed zero measurable return not because the technology doesn't work but because nobody measured the right things from the start.
Companies pour money into AI tools, They run pilots, They demo impressive features to their boards. And then six months later, someone asks the obvious question: "Is this actually working?" and there is no answer to that question.
The problem is that most businesses track tool adoption instead of real business results.
This guide will fix that issue. We'll walk you through a simple way to check if AI is actually working for your business. Anyone can do it. By the end of this guide, you'll know what to measure, when to measure it, and how to track the results. You'll also know how to create a simple dashboard to view the results.
Why Measuring AI Success Is So Hard
When you buy a piece of equipment, you can see it sitting on the factory floor. When you hire someone, you can watch them work. But AI? It runs in the background. It touches ten different workflows. And most of the time, nobody knows if it's actually making a difference.
That's why 66% of companies struggle to prove their AI is working, according to recent industry surveys. They spent the money. They did the rollout. But they can't point to a single number that proves it was worth it.
This creates a dangerous gap. Leadership thinks AI is a success because the vendor said so. The team using it every day isn't so sure. And finance can't tie any of it back to the bottom line.
If you're planning to implement AI in your business, measurement needs to be part of the plan from day one.
The Two Mistakes That Kill AI Measurement
Most companies make one of two mistakes. Sometimes both.
Mistake 1: Measuring activity instead of outcomes.
Logins don't matter. Features used don't matter. What matters is whether the work got better, faster, or cheaper. If your AI dashboard shows "500 queries this month" but can't tell you what those queries accomplished, you're measuring the wrong thing.
Mistake 2: Waiting too long to start tracking.
Here's what happens. A company launches an AI tool. Everyone uses it for six months. Then someone asks for proof it's working. But there's no baseline. Nobody recorded how things worked before AI. So there's nothing to compare against.
You can't prove improvement if you never documented where and what you started.
The 3-3-3 Framework for Measuring AI Success
We've seen dozens of companies struggle with this. So we built a simple framework that works across industries, team sizes, and AI tools. We call it the 3-3-3 Framework.
Three timeframes. Three levels. Three questions.
The 3 Timeframes
AI doesn't deliver value all at once. It shows up in stages. Your measurement approach needs to match.
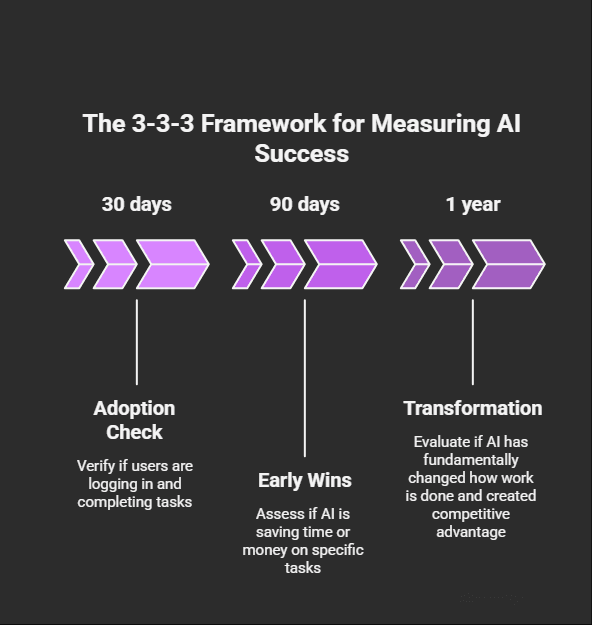
30 days - Is anyone using it?
In the first month, you're checking adoption. Are people logging in? Are they finishing tasks with the tool? If nobody's using it, nothing else matters. Low adoption at 30 days usually means poor training, bad tool fit, or unclear expectations.
90 days - Is it saving time or money?
By month three, you should see early wins. Tasks that took two hours now take thirty minutes. Reports that needed three people now need one. If you're not seeing these gains by day 90, something is off with the implementation.
1 year - Did it change how we work?
Real transformation takes time. After twelve months, ask bigger questions. Did we serve more customers without adding headcount? Did we enter new markets? Did our error rate drop significantly? This is where AI stops being a tool and starts being a competitive advantage.
The 3 Levels
AI affects individuals, teams, and the whole company differently. Measure all three.
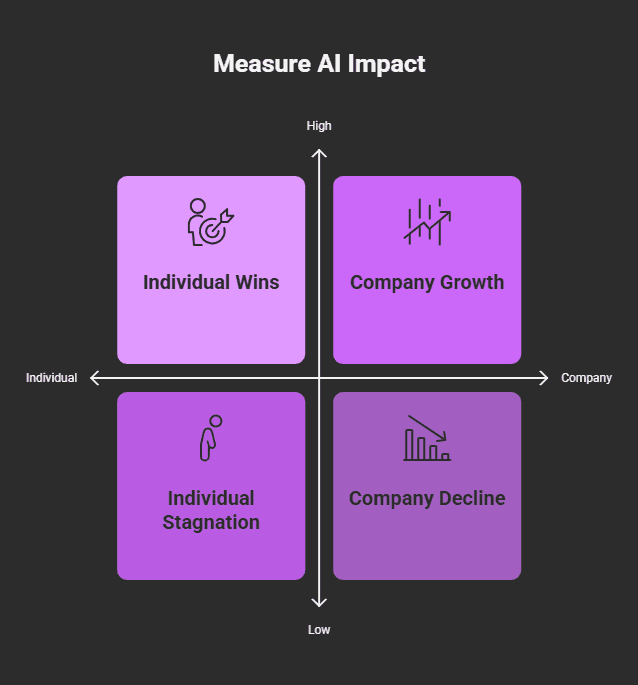
Individual - Is this person faster or better?
Look at the people using AI every day. Are they completing tasks quicker? Are they making fewer mistakes? Are they less frustrated with repetitive work? Individual wins are the foundation of everything else.
Team - Is this team producing more?
Zoom out to the team level. Is the sales team closing more deals? Is the finance team processing invoices faster? Is customer service resolving tickets without escalation? Team-level metrics show whether individual gains are adding up.
Company - Are we more profitable?
This is the question the board asks. Is revenue up? Are costs down? Is our customer satisfaction improving? Company-level metrics connect AI to business outcomes. Without them, AI stays a nice to have instead of a strategic priority.
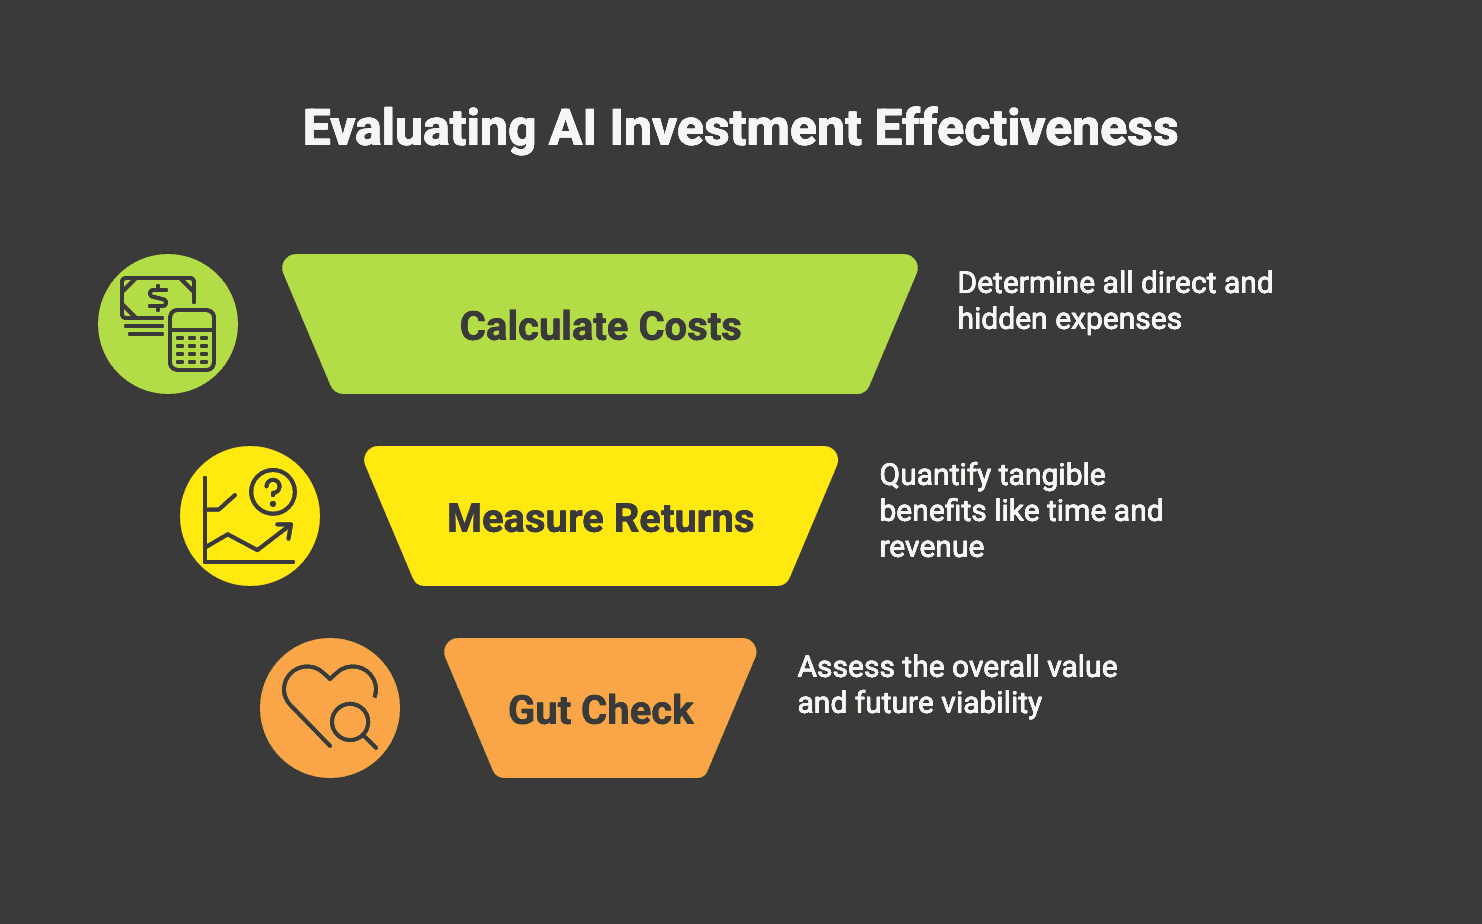
The 3 Questions to Ask at Each Stage
At every checkpoint, 30 days, 90 days, 1 year, ask these three questions:
What did this cost us? Include the tool, the training, the implementation time, and the ongoing maintenance. Don't forget the hidden costs. Our guide on calculating total AI implementation costs breaks this down in detail.
What did we get back? Time saved. Money saved. Errors prevented. Revenue increased. Be specific. "It made things better" isn't good enough.
Would we do it again? This is the gut check. Knowing what you know now, would you make the same investment? If the answer is "probably not," you've learned something valuable.
The 5 Numbers That Actually Matter
Frameworks are great. But you still need to know what to track.
After working with businesses across industries, we've narrowed it down to five metrics that tell you whether AI is working. You don't need fifty KPIs. You need these five.
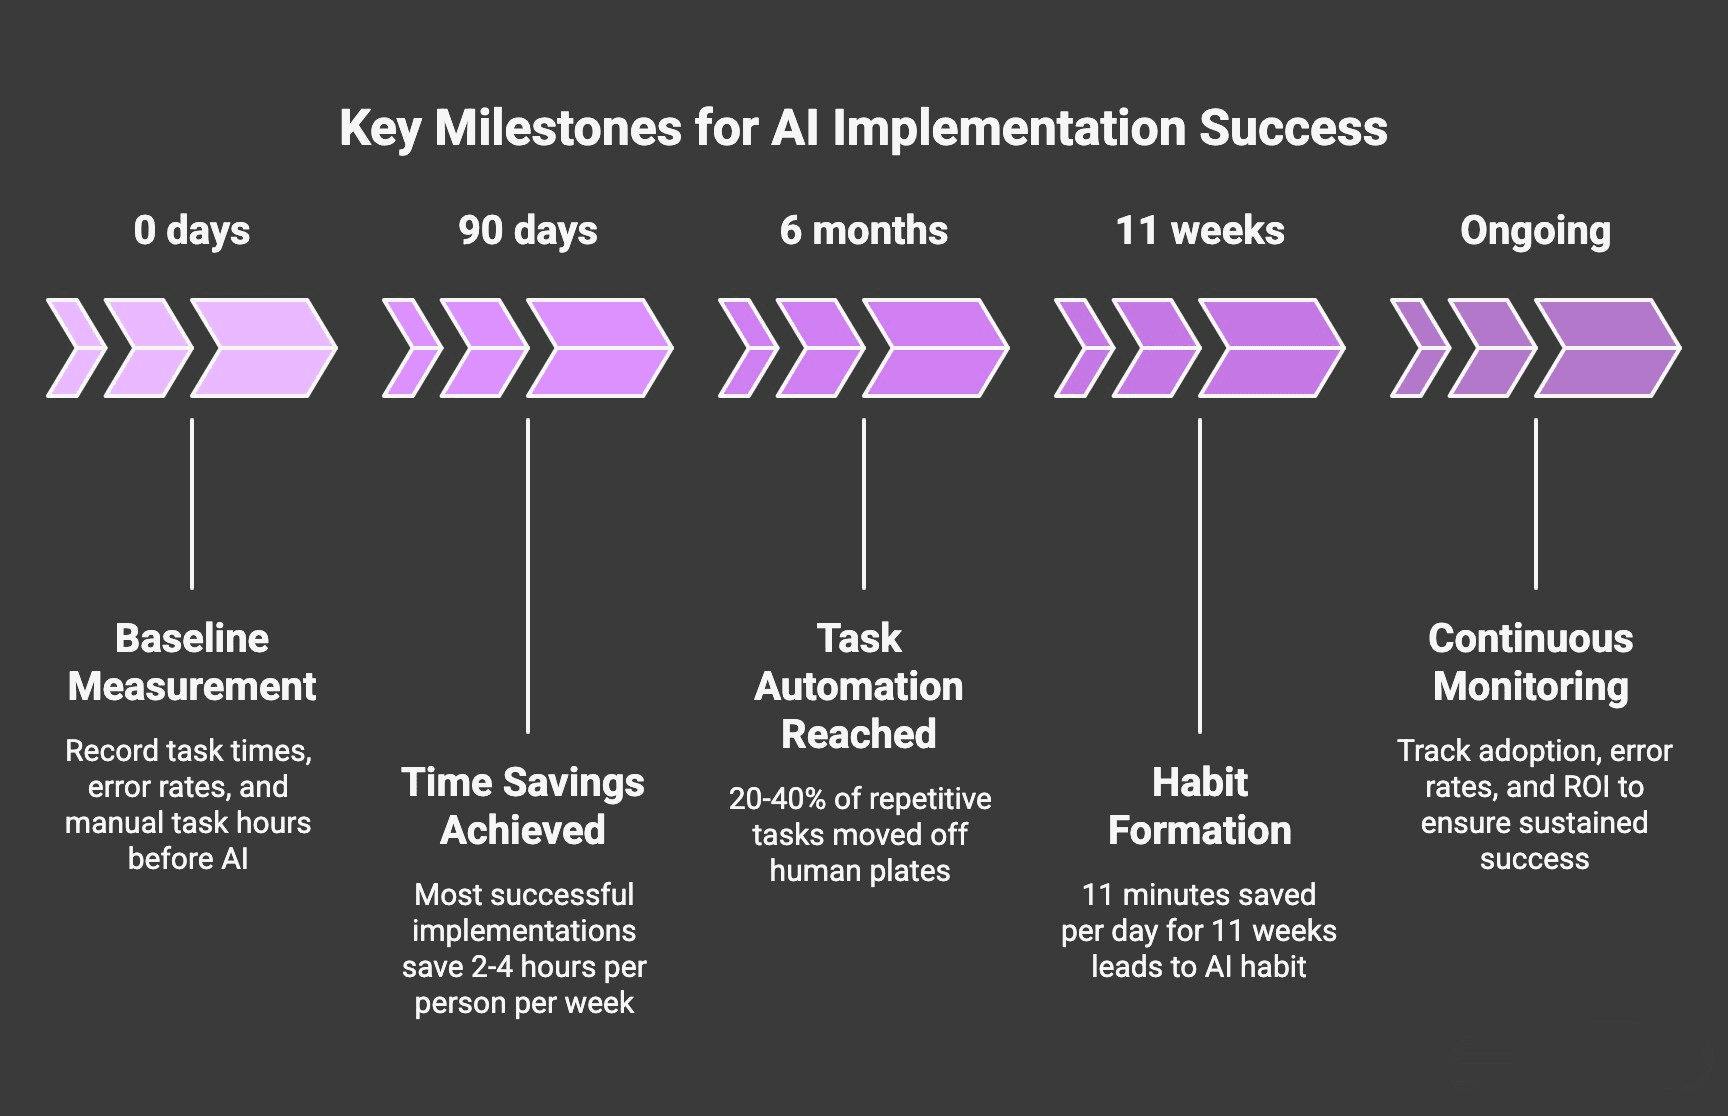
Number 1 - Time Saved Per Week
This is the simplest and most powerful metric.
Ask your team: "How much time did AI save you this week?" Then add it up.
Research from the Federal Reserve shows that workers using AI are 33% more productive per hour of AI use. That's not a small number. If your team isn't seeing time savings, either the tool isn't right or the training isn't sticking.
How to measure it: Compare how long tasks took before AI to how long they take now. Be specific. "Writing a proposal used to take 4 hours. Now it takes 90 minutes."
What good looks like: Most successful implementations save 2-4 hours per person per week within the first 90 days.
Number 2 - Money Saved Per Month
Time saved is great. Money saved is what gets budget approval.
Calculate this two ways. First, direct cost cuts that include subscriptions cancelled, vendors dropped, manual processes eliminated. Second, cost avoidance - work you would have hired for but didn't need to.
Use our AI ROI calculator to get your specific number. It walks you through the inputs and gives you a defensible figure you can share with leadership.
What good looks like: According to IBM research, top-performing companies see $10.30 back for every $1 spent on AI. Average companies see $3.70. If you're below $2, revisit your implementation.
Number 3 - Errors Caught or Prevented
Quality improvements are often the first win from AI.
Before AI, how many mistakes slipped through? Wrong data in reports. Missed steps in processes. Customer complaints about accuracy. After AI, how many of those still happen?
This metric matters because errors are expensive. One bad invoice can cost hours to fix. One wrong shipment can lose a customer. AI that catches mistakes before they spread pays for itself fast.
How to measure it: Track error rates by type. Compare the 30 days before AI to the 30 days after. Look for patterns.
Number 4 - Tasks Moved Off Human Plates
This isn't about replacing people. It's about freeing them up for work that matters.
Count the tasks that humans no longer do manually. Data entry. Report generation. Meeting summaries. Appointment scheduling. Each task that moves to AI is capacity returned to your team.
How to measure it: Make a list of tasks AI now handles fully or partially. Estimate the hours per week those tasks used to require.
What good looks like: The best AI implementations move 20-40% of repetitive tasks off human plates within six months.
Number 5 - People Actually Using It
Adoption matters more than you think.
A tool nobody uses creates zero value. Microsoft's research found there's a "tipping point" - 11 minutes saved per day for 11 weeks. That's when AI becomes a habit instead of an experiment. Before that point, adoption is fragile.
How to measure it: Track weekly active users. Track frequency of use. Survey the team on whether AI is making their work easier.
What to watch for: If adoption drops after month two, dig into why. Usually it's training gaps, tool friction, or unclear expectations about how to use it.

How Do You Calculate ROI on AI?
This question comes up in every boardroom. Here's the simple answer.
The formula: (What you gained − What you spent) ÷ What you spent
That's it. No fancy math required.
What counts as gains:
Hours saved, multiplied by hourly cost of those employees
Direct cost reductions (tools, vendors, contractors replaced)
Revenue increases tied to AI-enabled work
Error costs avoided
What counts as costs:
Software and licensing fees
Implementation and setup time
Training time for your team
Ongoing maintenance and support
Change management efforts
Real benchmarks: According to Deloitte's research, 74% of companies with advanced AI initiatives are meeting or exceeding their ROI expectations. The key word is "advanced", they've moved past pilots into real implementation.
Most companies see positive ROI within 12-24 months. That's longer than typical software payback periods. Set expectations accordingly.
If you want a personalized calculation, use our AI ROI calculator. It takes about five minutes and gives you a number you can actually defend.
What Should You Measure Before You Start?
Here's the part most companies skip. And it's the part that matters most.
You can't prove AI made things better if you don't know how things worked before AI.
The Pre-AI Snapshot Checklist
Before you flip the switch on any AI tool, document these numbers:
Time per task: How long does each key task take today? Be specific. "Processing an invoice takes 12 minutes on average. We process 500 per week."
Error rates: How many mistakes happen per week? Per month? What types of errors are most common?
Costs: What does this process cost right now? Include labor, tools, and any rework from errors.
Employee satisfaction: How do people feel about this work? Quick surveys work fine. You want a baseline for whether AI makes the job better or just different.
Output volume: How much work gets done in a typical week? Deals closed. Reports generated. Tickets resolved. Whatever matters for your business.
This takes time upfront. It saves enormous headaches later. When someone asks "Is AI working?" you'll have a clear answer.
If you're just starting your AI transformation roadmap, build measurement into your plan from day one.
Best Ways to Measure AI Success by Team
Different teams need different metrics. Here's what works.
Sales Teams
Lead response time: How fast do reps respond to new leads? AI should shrink this.
Deals closed per rep: Are reps closing more with AI assistance?
Pipeline velocity: How fast do deals move from stage to stage?
One enterprise sales team we worked with doubled their efficiency after using AI to time their outreach better. They engaged leads at exactly the right moment based on data signals. That's the kind of result that shows up in the numbers within weeks.
Finance Teams
Time to close the books: How many days does month-end take?
Errors in reports: How often do numbers need correction?
Cost per transaction: What does it cost to process an invoice, a payment, a report?
Customer Service Teams
Time to resolve tickets: How fast do issues get fixed?
First-contact resolution: What percentage of problems get solved without escalation?
Customer satisfaction: Are CSAT scores improving?
Why Do So Many AI Projects Fail to Show ROI?
The failure rate is real. Somewhere between 70% and 95% of AI projects don't deliver measurable value. That sounds grim. But understanding why helps you avoid the same fate.
It's rarely the technology that fails.
The AI usually works fine. What breaks is everything around it.
The three real reasons projects fail:
No clear problem to solve. Companies buy AI because it's trendy, not because they have a specific pain point. AI without a problem is just an expensive experiment.
No baseline to compare against. Without "before" numbers, you can't prove "after" is better. This is the measurement gap we talked about earlier.
No one owns the outcome. AI projects get handed off between IT, operations, and business teams. When nobody owns the result, nobody ensures the result happens.
If you're working with an AI transformation partner, make sure measurement and ownership are built into the engagement from the start.
How to Build a Simple AI Dashboard
The best dashboards aren't the ones with the most data. They're the ones people actually use.
Here's how to build one that drives decisions instead of collecting dust.
What Belongs On It (5-7 Metrics Max)
Your AI dashboard should answer one question: "Is AI helping my business?"
Stick to these core metrics:
Metric | What It Measures | Why It Matters |
Time Saved | Hours reclaimed per week | Shows immediate operational impact |
Cost Savings | Money saved monthly | Proves ROI to stakeholders |
Tasks Automated | Processes now using AI | Tracks adoption breadth |
Error Reduction | Mistakes prevented | Quality improvement metric |
Adoption Rate | People actively using AI | Ensures the tool isn't shelfware |
The rule: If you can't explain why a metric matters in one sentence, remove it.
How Often to Check It
Not all metrics need daily attention.
Weekly (Operations)
Time saved
Tasks automated
Error rates
These fluctuate with daily work. Weekly reviews catch trends without creating noise.
Monthly (Strategy)
Cost savings
Adoption rate
ROI progress
Strategic metrics need time to show meaningful change. Checking daily leads to overreaction.
The Traffic Light Approach
Every metric should have a clear status:
🟢 Green - On track or exceeding target
Time saved: Meeting or beating projections
Costs: Within or under budget
🟡 Yellow - Needs attention
Metrics flat for 2+ weeks
Adoption slowing down
🔴 Red - Immediate action required
Metrics declining
Over budget
Critical process failures
Set thresholds upfront. Don't decide what good looks like after seeing the numbers that's how bias creeps in.
Keep It Visible
A dashboard nobody looks at is expensive decoration.
Make it unavoidable:
Display on a screen in the office
Send automated weekly summaries to Slack or email
Review in every team standup (30 seconds max)
Make it actionable:
Each red metric should have an owner
Include last updated timestamp
Add one-click access to drill into problems
The best AI dashboard we've seen had exactly 4 metrics on a single screen. The worst had 47 charts across 12 tabs that nobody opened.
Start with less. Add only when someone asks "I wish I could see X." If nobody asks, you probably don't need it.
The Bottom Line
Measuring AI success isn't complicated. But it does require intention.
Start with the 3-3-3 Framework: three timeframes (30 days, 90 days, 1 year), three levels (individual, team, company), and three questions (what did it cost, what did we get back, would we do it again).
Track the 5 numbers that actually matter: time saved, money saved, errors caught, tasks automated, and adoption rate.
Build a dashboard that fits on one screen. Use the traffic light approach. Make someone responsible for every metric.
The companies that win with AI aren't the ones with the fanciest tools. They're the ones who measure ruthlessly from day one.
If you're ready to build a measurement framework that proves AI is working or figure out why it isn't book a consultation with Novoslo. We'll help you connect AI to outcomes that matter.